A few days ago I attended in Moscow Cassandra meet up with my presentation, from one of the participant, I heard about Facebook project presto for fast data analysis. I was very curious and hurry up to hands on it.
From Presto Site "Presto is a distributed SQL query engine optimized for ad-hoc analysis at interactive speed. It supports standard ANSI SQL, including complex queries, aggregations, joins, and window functions".
Historically Cassandra was lack of interactive Ad-hoc query, even it's doesn't support any aggregate function in CQL. For this reason, whenever we proposed our customers to utilize Cassandra as a database, they were always confused. However, for analysis data over Cassandra we have the following frameworks:
1) Hadoop Map Reduce
2) Spark and Shark
Also a few commercial projects like impala.
But Hadoop Map Reduce is definitely slow to use as Ad-Hoc queries. Spark is very fast with its RDD data models, but it also needs a few exercises to run queries. Spark with Shark even needs Hadoop HDFS to run queries over Cassandra. For these reasons, I am always looking for such SQL engine which can completely independently run over Cassandra Data. Here comes Presto with his simple architecture.
 From the Presto overview "The execution model of Presto is fundamentally different from Hive/MapReduce. Hive translates queries into multiple stages of MapReduce tasks that execute one after another. Each task reads inputs from disk and writes intermediate output back to disk. In contrast, the Presto engine does not use MapReduce. It employs a custom query and execution engine with operators designed to support SQL semantics. In addition to improved scheduling, all processing is in memory and pipelined across the network between stages. This avoids unnecessary I/O and associated latency overhead. The pipelined execution model runs multiple stages at once, and streams data from one stage to the next as it becomes available. This significantly reduces end-to-end latency for many types of queries".
Lets quickly setup a cluster and examine what it can do with Cassandra Data. For this blog post i will use 4 nodes Cassandra cluster with 2 Data Center. One Data Center will only For Data and the second data center will uses only for Data analysis. Physically, I am going to use 5 Virtual machines. One virtual machine for Presto coordinator.
First, we have to download 2 files, Presto and presto CLI. Now, lets setup the cluster
1) First, we will setup the coordinator node. Unzip the presto distribution some where in disk. Configure the node.properties, jvm.properties, config.properties and log.properties by documention.
For the coordinator node you should set up coordinator=true in the config.properties.
2) Similarly, set up the workers node. Make sure that config.properties has the following properties
coordinator=false
discovery-server.enabled=false
3)After installation of Presto, you need to deploy Cassandra plugin to every presto node.
On all presto nodes (server & worker nodes), add cassandra.properties to $PRESTO_HOME/etc/catalog (example see below)
I have create a keyspace named mnpkeyspace in Cassandra and one cql3 CF on it. CF contains following data model:

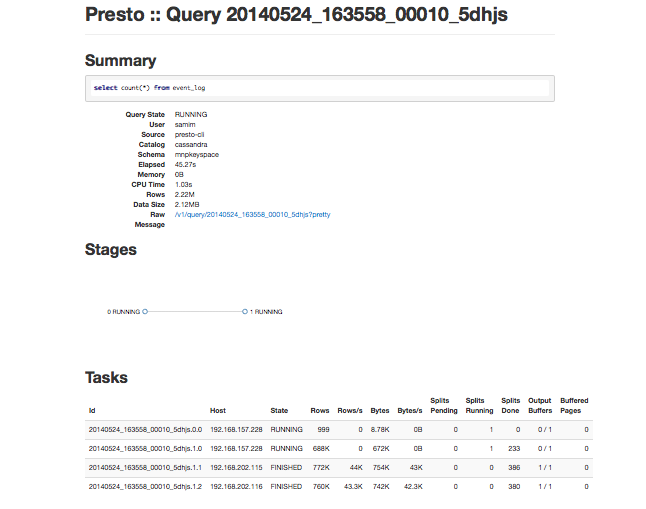
Lets check the summary:
 3 millions of rows in 2:28 minutes, impressive. Lets try group by
References:
1) https://www.facebook.com/notes/facebook-engineering/presto-interacting-with-petabytes-of-data-at-facebook/10151786197628920
2) http://prestodb.io/docs/current/index.html
From Presto Site "Presto is a distributed SQL query engine optimized for ad-hoc analysis at interactive speed. It supports standard ANSI SQL, including complex queries, aggregations, joins, and window functions".
Historically Cassandra was lack of interactive Ad-hoc query, even it's doesn't support any aggregate function in CQL. For this reason, whenever we proposed our customers to utilize Cassandra as a database, they were always confused. However, for analysis data over Cassandra we have the following frameworks:
1) Hadoop Map Reduce
2) Spark and Shark
Also a few commercial projects like impala.
But Hadoop Map Reduce is definitely slow to use as Ad-Hoc queries. Spark is very fast with its RDD data models, but it also needs a few exercises to run queries. Spark with Shark even needs Hadoop HDFS to run queries over Cassandra. For these reasons, I am always looking for such SQL engine which can completely independently run over Cassandra Data. Here comes Presto with his simple architecture.

Lets quickly setup a cluster and examine what it can do with Cassandra Data. For this blog post i will use 4 nodes Cassandra cluster with 2 Data Center. One Data Center will only For Data and the second data center will uses only for Data analysis. Physically, I am going to use 5 Virtual machines. One virtual machine for Presto coordinator.
First, we have to download 2 files, Presto and presto CLI. Now, lets setup the cluster
1) First, we will setup the coordinator node. Unzip the presto distribution some where in disk. Configure the node.properties, jvm.properties, config.properties and log.properties by documention.
For the coordinator node you should set up coordinator=true in the config.properties.
2) Similarly, set up the workers node. Make sure that config.properties has the following properties
coordinator=false
discovery-server.enabled=false
3)After installation of Presto, you need to deploy Cassandra plugin to every presto node.
On all presto nodes (server & worker nodes), add cassandra.properties to $PRESTO_HOME/etc/catalog (example see below)
connector.name=cassandra
cassandra.contact-points=host1
In my case i have two Cassandra nodes for analysis, thus i have 3 nodes presto cluster.
I have create a keyspace named mnpkeyspace in Cassandra and one cql3 CF on it. CF contains following data model:
CREATE TABLE event_log (
  request_id text,
  start_date timestamp,
  ctn text,
  event_name text,
  process_type text,
  id text,
  ban text,
  end_date timestamp,
  error boolean,
  info text,
  npid text,
  proc_inst_id text,
  system_name text,
  user_name text,
  xml_message text,
  PRIMARY KEY (request_id, start_date, ctn, event_name, process_type, id)
) WITH
  bloom_filter_fp_chance=0.010000 AND
  caching='KEYS_ONLY' AND
  comment='' AND
  dclocal_read_repair_chance=0.000000 AND
  gc_grace_seconds=864000 AND
  index_interval=128 AND
  read_repair_chance=0.100000 AND
  replicate_on_write='true' AND
  populate_io_cache_on_flush='false' AND
  default_time_to_live=0 AND
  speculative_retry='99.0PERCENTILE' AND
  memtable_flush_period_in_ms=0 AND
  compaction={'class': 'SizeTieredCompactionStrategy'} AND
  compression={'sstable_compression': 'LZ4Compressor'};
It has following data sets:request_id | start_date | ctn | event_name | process_type | id | ban | end_date | error | ------------+---------------+-----------+-------------+---------------+--------------------------------------+-----+----------+-------+- 1610250 | 1400852233559 | 123456789 | Provisining | PORTIN1610250 | 1e18abe7-e0e3-4dcf-9af2-351e7906cf19 | BAN | NULL | false | 1227843 | 1400851565307 | 123456789 | Provisining | PORTIN1227843 | a063d8cf-1865-4ef8-aedf-2dca7ba8278a | BAN | NULL | false |4) Now, it's time to run some sql quires. We have to use command line interface to run query.
java -jar presto-cli-0.68-executable.jar --server coordinator_host:port --catalog cassandra --schema mnpkeyspaceif every thing goes well, you should got command prompt with presto:mnpkeyspace
presto:mnpkeyspace> select count(*) from event_log;
  _col0
---------
 3000019
(1 row)

Query 20140524_163558_00010_5dhjs, FINISHED, 3 nodes
Splits: 1,001 total, 1,001 done (100.00%)
2:28 [3M rows, 2.86MB] [20.3K rows/s, 19.8KB/s]

Lets check the summary:
presto:mnpkeyspace> select count(*) from event_log group by event_name;
  _col0
---------
       3
 2999999
       4
       3
       1
       1
       1
       4
       3
(9 rows)

Query 20140524_163948_00011_5dhjs, FINISHED, 3 nodes
Splits: 1,004 total, 1,004 done (100.00%)
2:26 [3M rows, 2.86MB] [20.6K rows/s, 20.1KB/s]
Lets's make another try, this time aggregate function max:presto:mnpkeyspace> select max(start_date) from event_log group by event_name;
_col0
---------------
1400851465281
1400851434090
1400851432367
1400855180836
1400851464236
1400851465038
1400851210754
1400851210410
1400851210510
(9 rows)
Query 20140524_164959_00012_5dhjs, FINISHED, 3 nodes
Splits: 1,004 total, 1,004 done (100.00%)
2:20 [3M rows, 2.86MB] [21.4K rows/s, 20.9KB/s]
average read 21.4k rows per second. it's really impressive, note that i have only 2 Cassandra analytical nodes with 4 cpu and 16 GB RAM. It's enough for today, next time i have plan to examine more analytical functions with windows and will try to benchmark with Spark. All the credit goes for the Face book team, Happy weekend!!References:
1) https://www.facebook.com/notes/facebook-engineering/presto-interacting-with-petabytes-of-data-at-facebook/10151786197628920
2) http://prestodb.io/docs/current/index.html
Comments